
Design event-driven operational alerts using SQL signals and Microsoft Fabric workflows while rigorously testing end-to-end latency, alert quality, and system resilience under heavy loads.
Supported preview integration: Microsoft’s Database Hub guidance confirms that Fabric Activator can create alerts from Azure SQL Database performance telemetry. Activator queries a Microsoft-managed telemetry store; it does not connect directly to the database or add query load to it. Azure SQL Database supports templates and performance-chart alerts; Managed Instance and elastic pools are not supported by this Database Hub alerting preview. Rules require a Fabric-capacity workspace and consume capacity.
From SQL telemetry to action
For modern Azure solution architects and data engineers, the central question is not merely whether a capability exists on paper. It is whether that capability can be deployed safely, operated securely at scale, integrated cleanly with an existing landing zone framework, and decommissioned or rolled back without unexpected system downtime. As organizations increasingly adopt Microsoft Fabric for real-time intelligence, bridging operational relational stores like Azure SQL Database with analytical event streaming platforms becomes a priority. This article provides a comprehensive, practical decision framework and implementation blueprint for establishing Azure SQL Database alerts integrated with Fabric Activator workflows, ensuring your enterprise maintains high operational visibility without compromising data governance or incurring runaway cloud costs.
Operational alerting has traditionally relied on rigid monitoring agents or polling intervals that introduce latency and noise. By combining the low-latency querying capabilities of Azure SQL Database with the responsive event-driven processing of Microsoft Fabric Activator, teams can build sophisticated notification pipelines. However, bridging a transactional database with an analytics-first platform requires careful consideration of network topologies, authentication methods, signal deduplication, and cost management. Throughout this guide, we explore the architectural trade-offs, security baselines, and reliability checklists necessary to move from a basic proof of concept to a production-grade operational alerting solution.
What the preview supports
Architects must look beyond simple feature checklists when designing mission-critical monitoring solutions. Implementing operational alerts that span across Azure SQL Database and Microsoft Fabric involves intricate dependencies regarding identity federation, network boundaries, automated deployment pipelines, structured logging, sensitive data classification, and total cost of ownership. Preview capabilities demand additional scrutiny, particularly concerning service limits, SLA commitments, and API version stability.
When evaluating this architecture, consider the following technical pillars:
- Identity and Access Management: Ensuring secure, token-based authentication between database resources and Fabric items without embedding static connection strings.
- Network Isolation: Managing private endpoints, firewalls, and data movement across service boundaries securely.
- State and Deduplication: Preventing alert fatigue by intelligently handling recurring signals and transient database states.
- Operational Overhead: Balancing the agility of low-code workflow tools with the rigid governance requirements of enterprise IT.
Alert fatigue and operational ownership
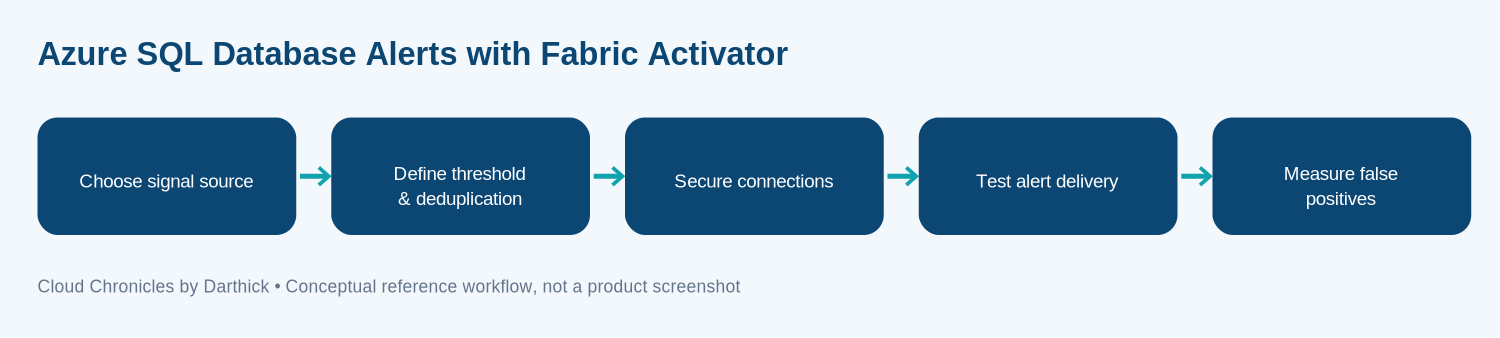
The conceptual architecture illustrates a multi-stage implementation sequence. It is important to emphasize that this diagram represents a logical design pattern rather than a claim that native wizard-driven bindings exist for every single transition. Enterprise architects should adapt this flow to match their organization’s specific cloud landing zone, hub-spoke network topology, and security governance models.
In stage one, transactional logs or analytical queries capture state changes within the relational database. Stage two involves transmitting these signals securely, often via intermediate streaming layers or scheduled query pipelines, into the Fabric ecosystem. Stage three processes the incoming stream within Fabric Activator, evaluating predefined thresholds against business logic. Stage four handles deduplication and notification routing, ensuring operational teams receive actionable insights through preferred communication channels such as Microsoft Teams or email. Finally, stage five encompasses telemetry collection, auditing, and continuous refinement of the alert conditions to minimize false positives.
Data access checkpoints
Deploying this monitoring architecture requires a structured, phase-by-phase approach. Below are the five core operational checkpoints that must be satisfied before moving any workload from a development environment into production.
Choose signal source
Define the exact database table, view, or change-tracking stream that acts as the trigger. Establish clear data owners, input/output contracts, and potential failure modes.
Define threshold and deduplication
Configure numerical or state-based evaluation rules within Activator. Implement windowing functions or cool-down periods to suppress alert storms.
Secure connections
Enforce Microsoft Entra authentication, restrict network paths using private endpoints, and manage secrets securely without embedding credentials in code.
Test alert delivery
Validate end-to-end latency by injecting controlled synthetic faults into the database and verifying that notifications arrive accurately and on time.
Measure false positives
Monitor the signal-to-noise ratio over a multi-week staging period. Adjust thresholds iteratively to prevent operator burnout and alert fatigue.
Detailed analysis of signal ingestion mechanisms
Choosing the correct signal source is the single most critical architectural decision in this workflow. When working with Azure SQL Database, teams typically weigh three primary integration patterns: scheduled database polling via data factory pipelines, streaming database changes via Event Hubs and Change Data Capture (CDC), or direct analytical querying from Microsoft Fabric mirrored databases. Each pattern carries distinct performance implications for the underlying transactional engine.
Scheduled polling is simple to implement but introduces polling latency and places recurring read overhead on the database. Conversely, Change Data Capture combined with an event streaming backbone offers near-real-time responsiveness with minimal transactional lock contention, but increases architectural complexity and infrastructure costs. Architects must analyze their Recovery Time Objectives (RTO) and transactional throughput requirements before committing to a specific ingestion pattern.
Rule validation and security baselines
Enterprise deployments demand strict adherence to zero-trust principles. Whenever supported, rely exclusively on Microsoft Entra identities and service principals rather than SQL authentication credentials. Apply the principle of least privilege across all role-based access control (RBAC) assignments within both Azure and Microsoft Fabric. Secrets, connection strings, and API keys, if required for legacy integrations, must be managed centrally within Azure Key Vault and rotated according to corporate compliance schedules.
Network security boundaries must be explicitly defined. Utilize Azure Private Link to ensure that data traffic between SQL databases, ingestion pipelines, and Fabric workspaces remains within the Microsoft backbone network, avoiding exposure to the public internet. Furthermore, establish comprehensive audit logging for all alert rule modifications, access attempts, and notification dispatches. Define a clear data retention policy and assign an explicit incident response owner responsible for addressing monitoring system failures.
Notification ownership and resilience
High availability and disaster recovery planning must encompass the entire alerting pipeline, not just the primary database. Engineers must test system behavior under adverse conditions, including intermittent network partitions, API rate throttling, partial ingestion failures, and regional service degradations. Side-effecting operations, such as triggering automated remediation scripts or sending external webhooks, must be designed to be idempotent to prevent duplicate actions during retry cycles.
Operational monitoring requires tracking key telemetry metrics, including ingestion latency, error rates, compute consumption, and dependency health. Every implementation must include a well-documented runbook detailing exactly how to isolate, disable, or bypass the alerting pipeline during maintenance windows or unexpected outages without disrupting unrelated database workloads or core business applications.
Capacity impact and cost governance
Cloud financial management is essential when deploying continuous event-driven architectures. Total cost of ownership calculations must account for multiple billing dimensions: Azure SQL Database compute and storage tiers, data egress charges across network boundaries, Microsoft Fabric capacity units (CUs), ingestion pipeline executions, and external API or notification gateway costs.
Organizations should benchmark a representative workload in a non-production environment rather than relying solely on vendor pricing calculators or generic estimates. Establishing granular budget alerts, tagging all associated resources by cost center, and regularly reviewing Fabric capacity utilization will prevent unexpected financial surprises. For features currently in preview, verify billing meters, preview agreements, and SLA terms before committing to large-scale production adoption.
Final assessment
Implementing Azure SQL Database alerts integrated with Microsoft Fabric workflows should be approached as a strategic architectural capability rather than a simple feature checkbox. Success depends on establishing clear operational requirements, validating current service contracts and API limits, and adopting the technology incrementally backed by empirical evidence gathered from a controlled pilot program. By maintaining a disciplined focus on security, reliability, and cost governance, organizations can build robust, responsive monitoring systems that empower engineering teams without introducing unnecessary operational risk.
Useful references
Microsoft documentation or official announcement on Fabric Activator. Verify the latest software versions, API contracts, and related release notes before deploying any architecture to production environments.
Editorial status: prepared for review; not published.
Explore Data Analytics Solutions
Discover more expert strategies and technical guides in our resource library.
More articles on Data & Analytics are available in the blog archive.